With this, youll see information about individuals and how theyre relative to each other.
Most tools show one thing or the other.
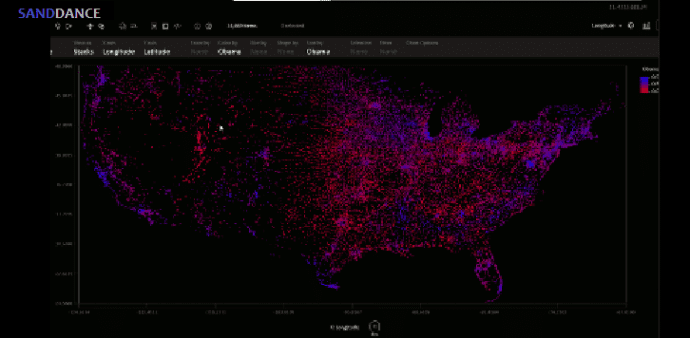
With SandDance, it’s possible for you to look at data from many different angles.
SandDance will be announced as part of Power BI at the Data Insights Summit on March 22.
There are a number of visualization options including 3D scatterplot, maps, charts and histograms.
Also, note that SandDance will run better on computers that have a modern graphics card.

source: www.techworm.net
